This function converts common markdown language to an R plotmath expression. plot2() uses this function internally to convert plot titles and axis titles.
Value
An expression if x is length 1, or a list of expressions otherwise
Details
This function only supports common markdown (italic, bold, bold-italic, subscript, superscript), but also supports some additional functionalities for more advanced expressions using R plotmath. Please see Examples.
In plot2(), this function can be also set to argument category.labels to print the data values as expressions:
plot2(..., category.labels = md_to_expression)
Examples
# use '*' for italics, not '_', to prevent conflicts with variable naming
md_to_expression("this is *italic* text, this is _not italic_ text")
#> expression(paste("this is ", italic("italic"), " text, this is _not italic_ text"))
md_to_expression("this is **bold** text")
#> expression(paste("this is ", bold("bold"), " text"))
md_to_expression("this is ***bold and italic*** text")
#> expression(paste("this is ", bolditalic("bold and italic"), " text"))
# subscript and superscript can be done in HTML or markdown with curly brackets:
md_to_expression("this is some<sub>subscripted text</sub>, this is also_{subscripted} text")
#> expression(paste("this is ", some["subscripted text"], ", this is ",
#> also["subscripted"], " text"))
md_to_expression("this is some<sup>superscripted text</sup>, this is also^{superscripted} text")
#> expression(paste("this is ", some^"superscripted text", ", this is also"^"superscripted",
#> " text"))
# use $...$ to use any plotmath expression as-is (see ?plotmath):
md_to_expression("text $omega$ text, $a[x]$")
#> expression(paste("text ", omega, " text, ", a[x]))
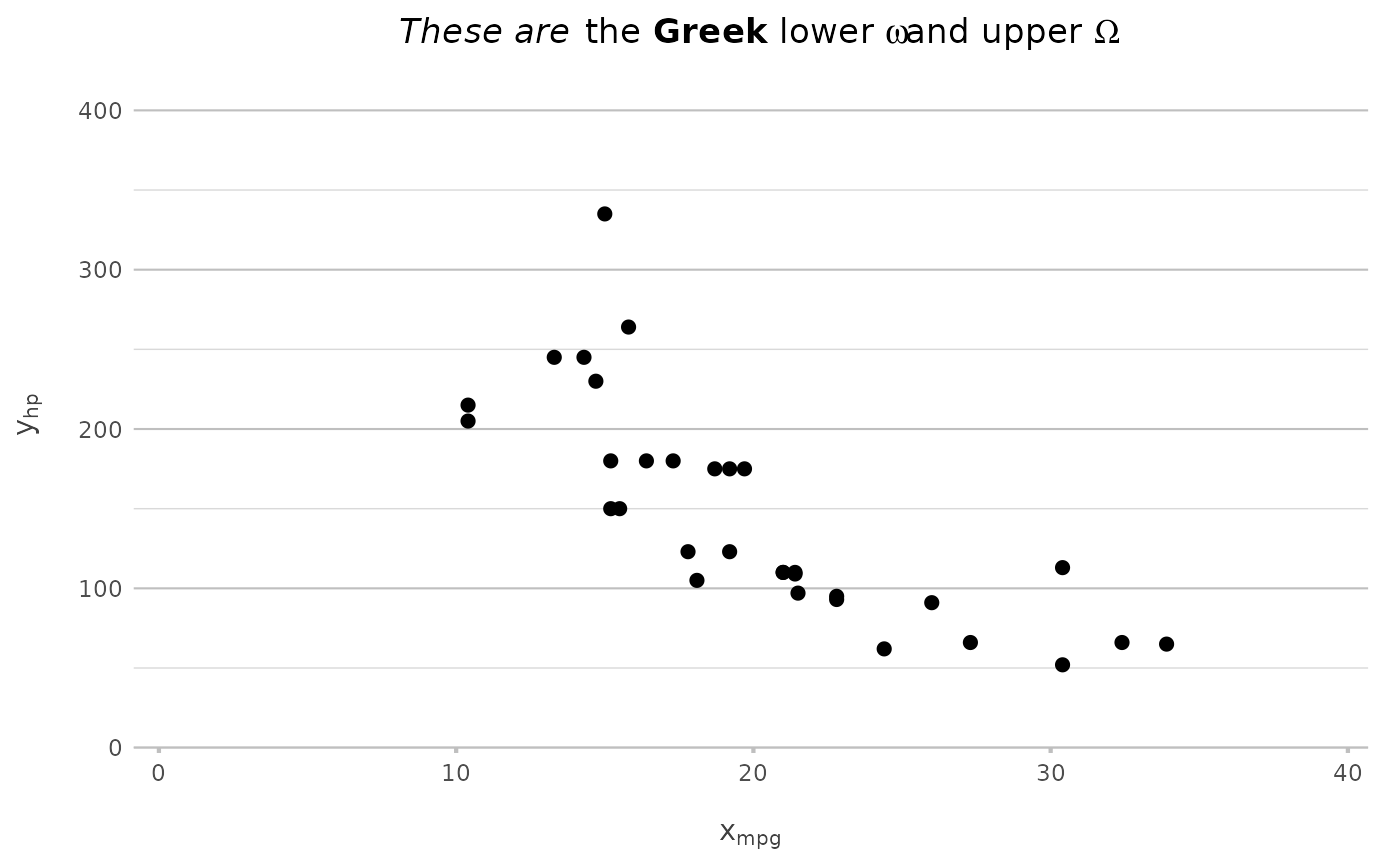
mtcars |>
plot2(mpg, hp,
title = "*These are* the **Greek** lower $omega$ and upper $Omega$",
x.title = "x_{mpg}",
y.title = "y_{hp}")
#> ℹ Using type = "point" since both axes are numeric
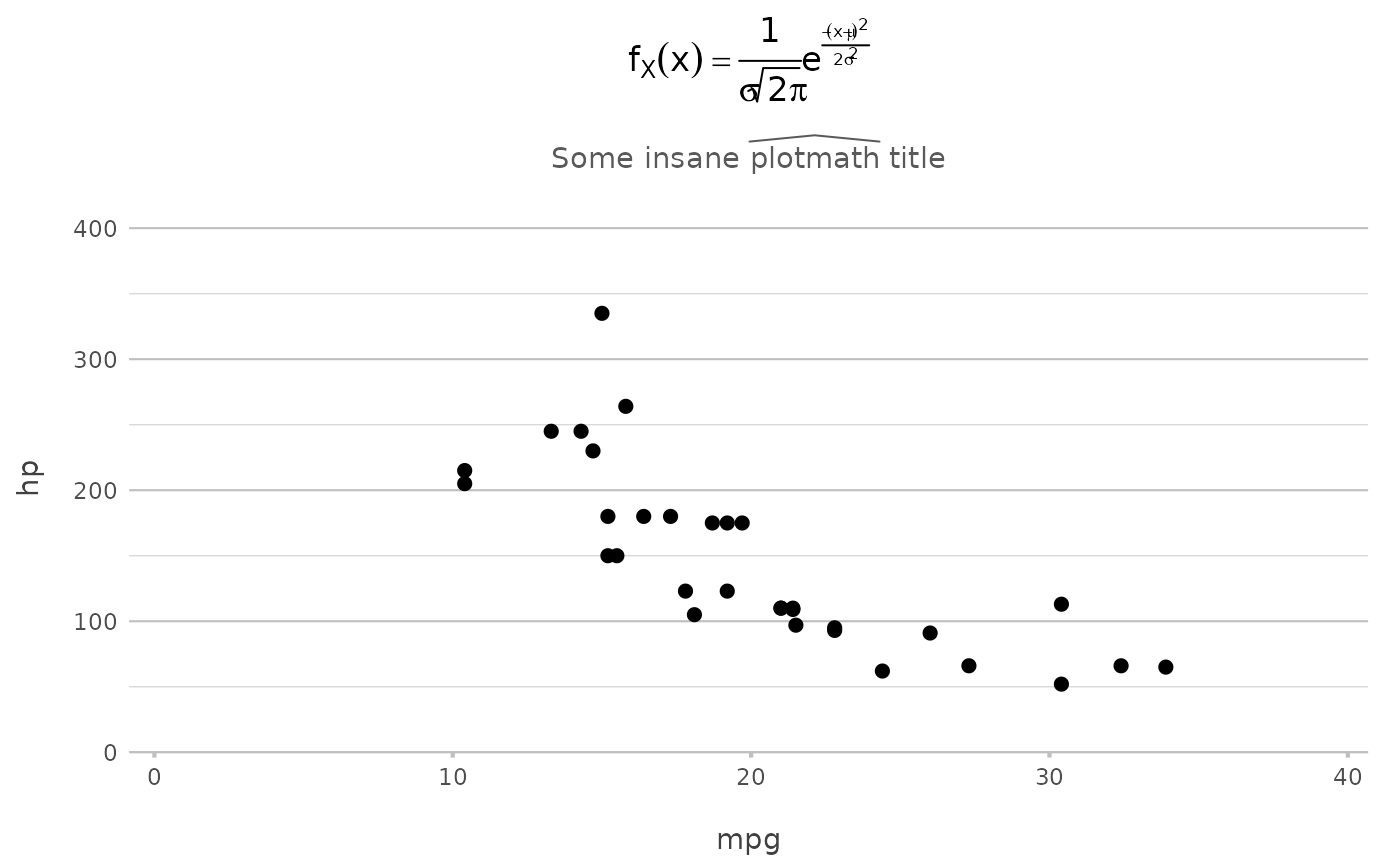
 mtcars |>
plot2(mpg, hp,
title = "$f[X](x)==frac(1, sigma*sqrt(2*pi))*plain(e)^{frac(-(x-mu)^2, 2*sigma^2)}$",
subtitle = "Some insane $widehat(plotmath)$ title")
#> ℹ Using type = "point" since both axes are numeric
mtcars |>
plot2(mpg, hp,
title = "$f[X](x)==frac(1, sigma*sqrt(2*pi))*plain(e)^{frac(-(x-mu)^2, 2*sigma^2)}$",
subtitle = "Some insane $widehat(plotmath)$ title")
#> ℹ Using type = "point" since both axes are numeric