Retrieves, expands, and prints colours or palettes from R, viridisLite, or user-defined sources, with support for registering and unregistering custom colour sets for (automatic) reuse in plots.
Usage
get_colour(x, length = 1, opacity = 0)

register_colour(...)

unregister_colour(regex)

add_white(x, white)
Arguments
- x
Colour or colour palette name. Input can be:
One of the colourblind-safe
viridisLitepalettes:"viridis""magma""inferno""plasma""cividis""rocket""mako""turbo"
One of the built-in R palettes (these are from R 4.5.1):
"Accent""Alphabet""Classic Tableau""Dark 2""Okabe-Ito""Paired""Pastel 1""Pastel 2""Polychrome 36""R3""R4""Set 1""Set 2""Set 3""Tableau 10""ggplot2""grayscale""greyscale""heatmap""rainbow""terrain""topo"
One of the 657 built-in
colours()in R (even case-insensitive), such as"bisque","blue1","chartreuse1","cornsilk4","lightcoral"One of the pre-registered colours using
register_colour()
- length
Size of the vector to be returned.
- opacity
Amount of opacity (0 = solid, 1 = transparent).
- ...
Named vectors with known, valid colours. They must be coercible with
get_colour().- regex
A regular expression to unregister colours.
- white
A number between
[0, 1]to add white tox.
Value
character vector in HTML format (i.e., "#AABBCC") with new class colour
Details
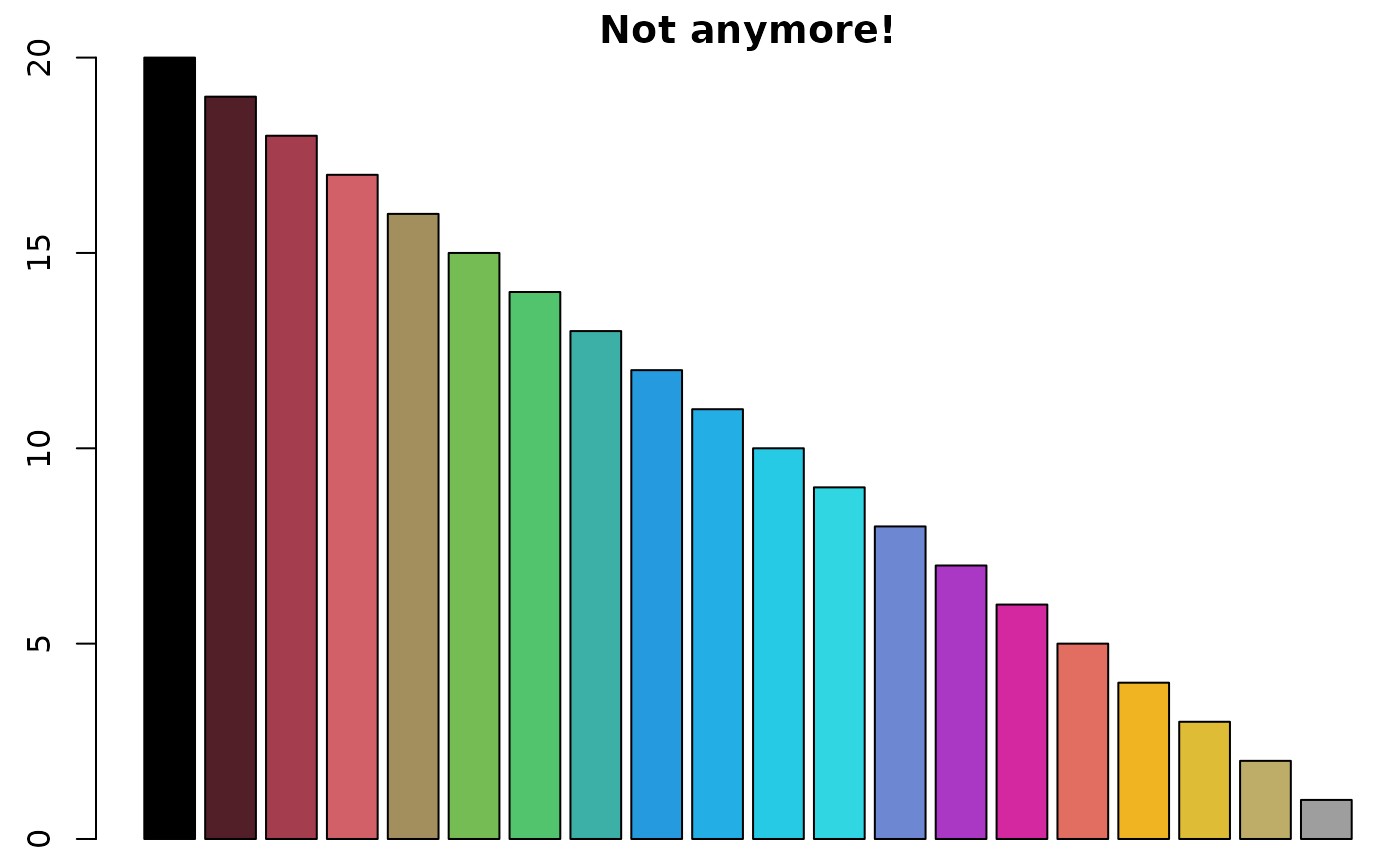
Limitless Palette Length
A palette from R will be expanded where needed, so even get_colour("R4", length = 20) will work, despite "R4" only supporting a maximum of eight colours.
Registering Colours In Another Package
To register/unregister colours in another package, add something like this to a package file R/zzz.R:
#' @importFrom plot2 register_colour
.onLoad <- function(...) {
  register_colour(
    my_colour1  = "#007A8A",
    my_colour2  = "#2E8540",
    my_colour3  = "#5B3FA8",
    my_colours  = c("my_colour1", "my_colour2", "my_colour3"))

  # set as default upon package load
  options(plot2.colour = "my_colours",
          plot2.colour_font_secondary = "my_colour1")
}

#' @importFrom plot2 unregister_colour
.onUnload <- function(...) {
  unregister_colour("^my_colour") # this is a regular expression
  options(plot2.colour = NULL,
          plot2.colour_font_secondary = NULL)
}
Do not forget to add plot2 to Imports: in the DESCRIPTION file of your package.
Examples
get_colour(c("red", "tan1", "#ffa", "FFAA00"))
#> [1] "#FF0000" "#FFA54F" "#FFFFAA" "#FFAA00"
par(mar = c(0.5, 2.5, 1.5, 0)) # set plot margins for below plots
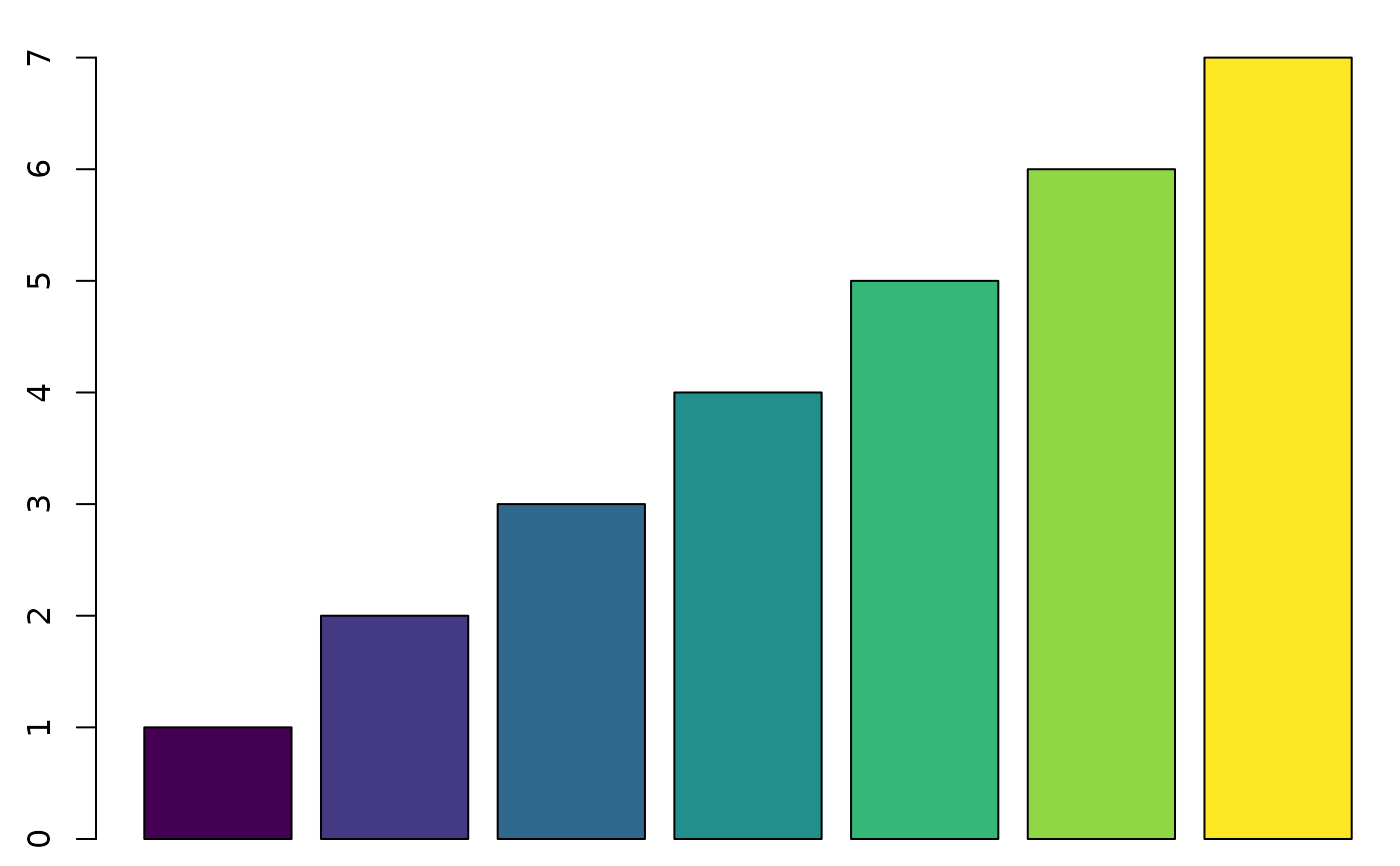
# all colourblind-safe colour palettes from the famous viridisLite package
barplot(1:7,
col = get_colour("viridis", 7))
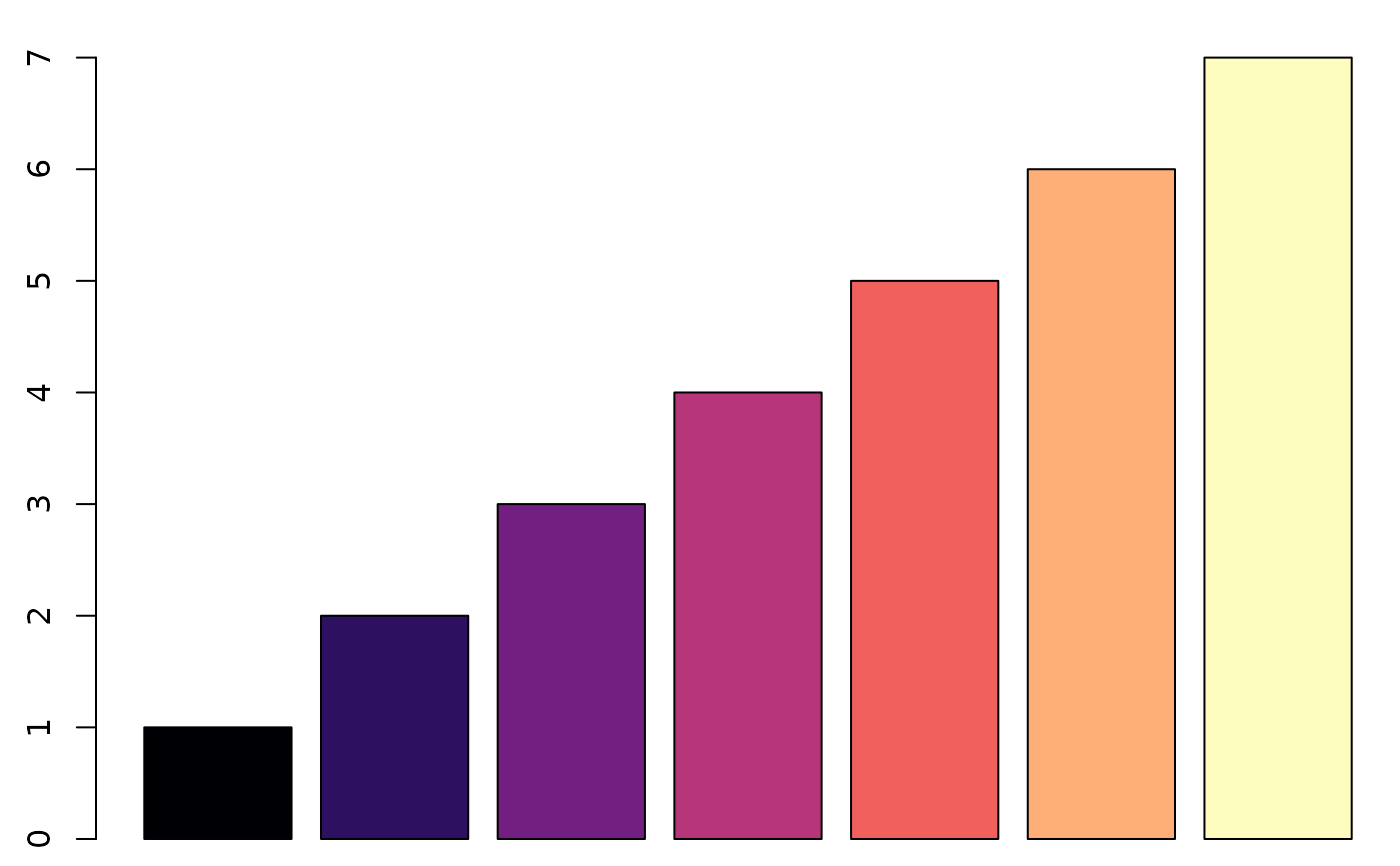
 barplot(1:7,
col = get_colour("magma", 7))
barplot(1:7,
col = get_colour("magma", 7))
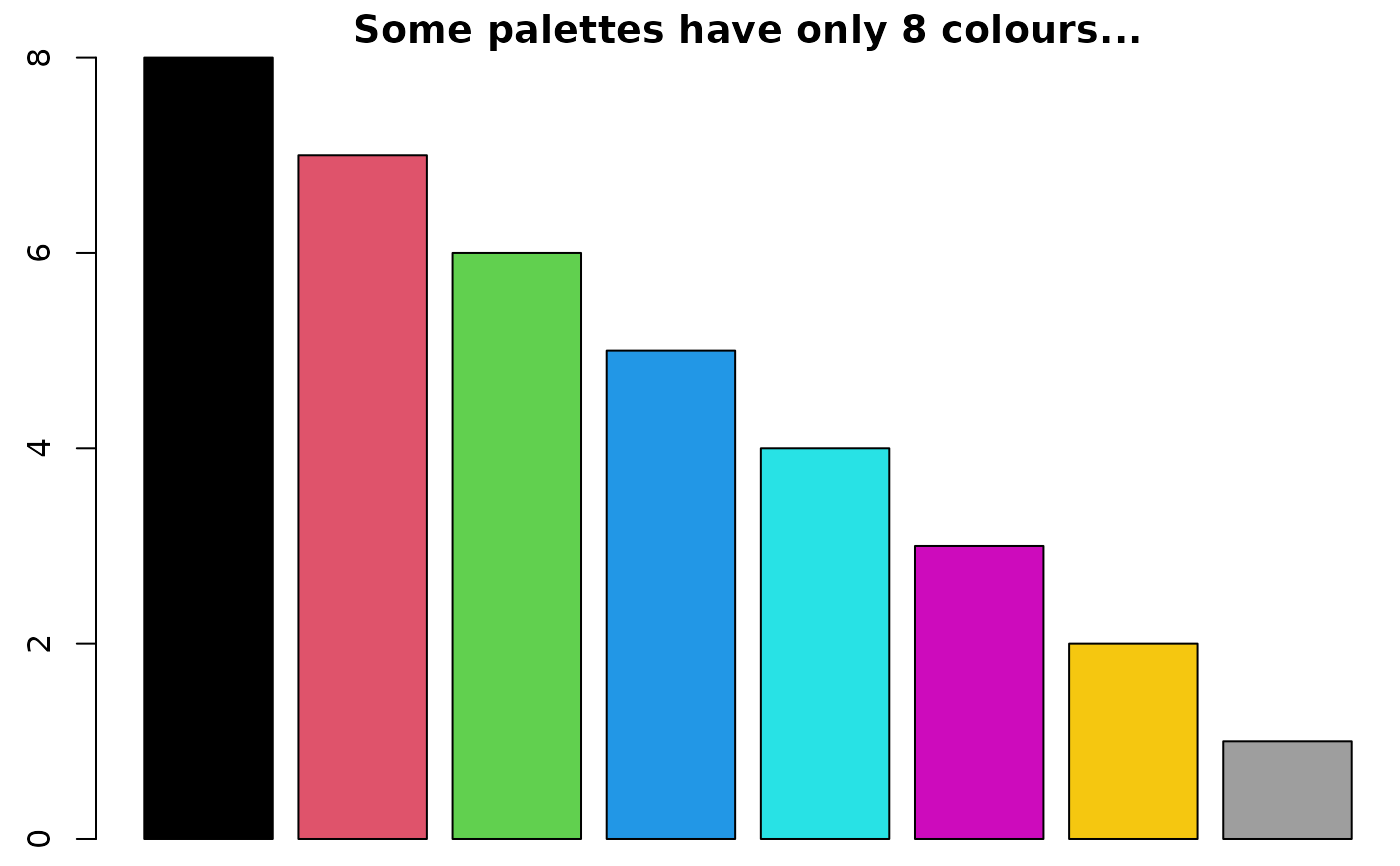
 barplot(8:1,
col = get_colour("R4", 8),
main = "Some palettes have only 8 colours...")
barplot(8:1,
col = get_colour("R4", 8),
main = "Some palettes have only 8 colours...")
 barplot(20:1,
col = get_colour("R4", 20),
main = "Not anymore!")
barplot(20:1,
col = get_colour("R4", 20),
main = "Not anymore!")
 # Registering Colours --------------------------------------------------
# to register colours, use named input - the values will be evaluated
# with get_colour()
get_colour("red123")
#> [1] "#595959"
register_colour(red123 = "red", red456 = "#ff0000", red789 = "f00")
#> 3 colours registered.
get_colour("red123")
#> [1] "#FF0000"
get_colour("red456")
#> [1] "#FF0000"
get_colour("red789")
#> [1] "#FF0000"
# you can also register a group name
register_colour(red_group = c("red123", "ff4400", "red3", "red4"))
#> 1 colour set registered.
get_colour("red_group")
#> [1] "#FF0000"
get_colour("red_group", 3)
#> [1] "#FF0000" "#FF4400" "#CD0000"
# Registering colours is ideal for your (organisational) style in plots.
# Let's say these are your style:
register_colour(navy_blue = "#1F3A93",
burnt_orange = "#D35400",
forest_green = "#2C6F47",
goldenrod_yellow = "#DAA520",
slate_grey = "#708090",
plum_purple = "#8E4585")
#> 6 colours registered.
# Then register the whole colour list too:
register_colour(my_organisation = c("navy_blue", "burnt_orange",
"forest_green", "goldenrod_yellow",
"slate_grey", "plum_purple"))
#> 1 colour set registered.
# Check that it works:
get_colour("my_organisation", length = 6)
#> [1] "#1F3A93" "#D35400" "#2C6F47" "#DAA520" "#708090" "#8E4585"
# Now use it in plots as you like:
iris |>
plot2(x = Species, y = where(is.double), colour = "my_organisation")
#> ℹ Using type = "boxplot" since all groups in Species and category contain at
#> least three values
#> ℹ Using y = c(Petal.Length, Petal.Width, Sepal.Length, Sepal.Width)
#> ! Invalid colour set ("red123"), replacing with default ggplot2 colour
# Registering Colours --------------------------------------------------
# to register colours, use named input - the values will be evaluated
# with get_colour()
get_colour("red123")
#> [1] "#595959"
register_colour(red123 = "red", red456 = "#ff0000", red789 = "f00")
#> 3 colours registered.
get_colour("red123")
#> [1] "#FF0000"
get_colour("red456")
#> [1] "#FF0000"
get_colour("red789")
#> [1] "#FF0000"
# you can also register a group name
register_colour(red_group = c("red123", "ff4400", "red3", "red4"))
#> 1 colour set registered.
get_colour("red_group")
#> [1] "#FF0000"
get_colour("red_group", 3)
#> [1] "#FF0000" "#FF4400" "#CD0000"
# Registering colours is ideal for your (organisational) style in plots.
# Let's say these are your style:
register_colour(navy_blue = "#1F3A93",
burnt_orange = "#D35400",
forest_green = "#2C6F47",
goldenrod_yellow = "#DAA520",
slate_grey = "#708090",
plum_purple = "#8E4585")
#> 6 colours registered.
# Then register the whole colour list too:
register_colour(my_organisation = c("navy_blue", "burnt_orange",
"forest_green", "goldenrod_yellow",
"slate_grey", "plum_purple"))
#> 1 colour set registered.
# Check that it works:
get_colour("my_organisation", length = 6)
#> [1] "#1F3A93" "#D35400" "#2C6F47" "#DAA520" "#708090" "#8E4585"
# Now use it in plots as you like:
iris |>
plot2(x = Species, y = where(is.double), colour = "my_organisation")
#> ℹ Using type = "boxplot" since all groups in Species and category contain at
#> least three values
#> ℹ Using y = c(Petal.Length, Petal.Width, Sepal.Length, Sepal.Width)
#> ! Invalid colour set ("red123"), replacing with default ggplot2 colour
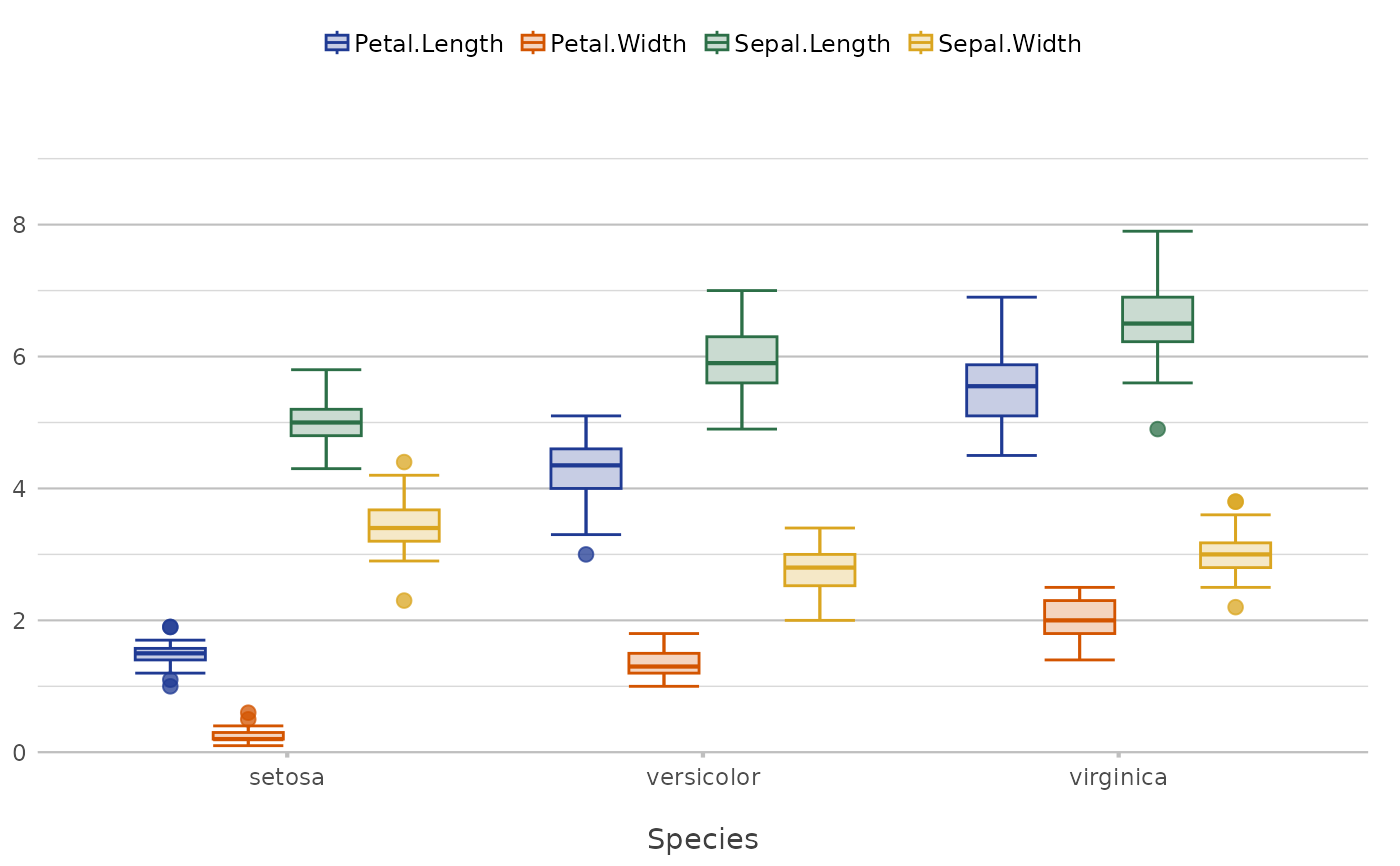 # Or even set the option to use it in any future plot:
options(plot2.colour = "my_organisation")
iris |>
plot2(x = Species, y = where(is.double))
#> ℹ Using type = "boxplot" since all groups in Species and category contain at
#> least three values
#> ℹ Using y = c(Petal.Length, Petal.Width, Sepal.Length, Sepal.Width)
# Or even set the option to use it in any future plot:
options(plot2.colour = "my_organisation")
iris |>
plot2(x = Species, y = where(is.double))
#> ℹ Using type = "boxplot" since all groups in Species and category contain at
#> least three values
#> ℹ Using y = c(Petal.Length, Petal.Width, Sepal.Length, Sepal.Width)
 # reset option again
options(plot2.colour = NULL)
# Use add_white() to add white to existing colours:
colours <- get_colour("R4", 6)
colours
#> [1] "#000000" "#DF536B" "#61D04F" "#2297E6" "#28E2E5" "#CD0BBC"
add_white(colours, 0.25)
#> [1] "#3F3F3F" "#E77E90" "#88DB7B" "#59B1EC" "#5DE9EB" "#D948CC"
add_white(colours, 0.5)
#> [1] "#7F7F7F" "#EFA9B5" "#B0E7A7" "#90CBF2" "#93F0F2" "#E685DD"
add_white(colours, 0.75)
#> [1] "#BFBFBF" "#F7D4DA" "#D7F3D3" "#C7E5F8" "#C9F7F8" "#F2C2EE"
add_white("red", 0) # 100% red
#> [1] "#FF0000"
add_white("red", 1/256)
#> [1] "#FF0101"
add_white("red", 1/128)
#> [1] "#FF0202"
add_white("red", 1/64)
#> [1] "#FF0404"
add_white("red", 1/32)
#> [1] "#FF0808"
add_white("red", 1/16)
#> [1] "#FF1010"
add_white("red", 1/8)
#> [1] "#FF1F1F"
add_white("red", 1/4)
#> [1] "#FF3F3F"
add_white("red", 1/2)
#> [1] "#FF7F7F"
add_white("red", 1) # 100% white
#> [1] "#FFFFFF"
# reset option again
options(plot2.colour = NULL)
# Use add_white() to add white to existing colours:
colours <- get_colour("R4", 6)
colours
#> [1] "#000000" "#DF536B" "#61D04F" "#2297E6" "#28E2E5" "#CD0BBC"
add_white(colours, 0.25)
#> [1] "#3F3F3F" "#E77E90" "#88DB7B" "#59B1EC" "#5DE9EB" "#D948CC"
add_white(colours, 0.5)
#> [1] "#7F7F7F" "#EFA9B5" "#B0E7A7" "#90CBF2" "#93F0F2" "#E685DD"
add_white(colours, 0.75)
#> [1] "#BFBFBF" "#F7D4DA" "#D7F3D3" "#C7E5F8" "#C9F7F8" "#F2C2EE"
add_white("red", 0) # 100% red
#> [1] "#FF0000"
add_white("red", 1/256)
#> [1] "#FF0101"
add_white("red", 1/128)
#> [1] "#FF0202"
add_white("red", 1/64)
#> [1] "#FF0404"
add_white("red", 1/32)
#> [1] "#FF0808"
add_white("red", 1/16)
#> [1] "#FF1010"
add_white("red", 1/8)
#> [1] "#FF1F1F"
add_white("red", 1/4)
#> [1] "#FF3F3F"
add_white("red", 1/2)
#> [1] "#FF7F7F"
add_white("red", 1) # 100% white
#> [1] "#FFFFFF"