Transform input to a percentage. The actual values are numeric, but will be printed as formatted percentages.
Arguments
Details
Printing percentages will always have a percentage symbol and is never written in scientific format (like 2.5e+04%).
The function percentage is a wrapper around format(as.percentage(...)) with automatic determination of the number of digits, varying between 0 and 1. It also, unlike R, rounds according to basic math rules: percentage(0.4455) returns "44.6%" and not "44.5%". This function always returns a character, and can also be used in plotting, see Examples.
Examples
proportion <- as.percentage(c(0.25, 2.5, 0.0025))
proportion
#> [1] 25.00% 250.00% 0.25%
sum(proportion)
#> [1] 275.25%
max(proportion)
#> [1] 250%
mean(proportion)
#> [1] 91.75%
as.percentage(2.5e-14)
#> [1] 0%
as.percentage(pi)
#> [1] 314.159%
format(as.percentage(pi))
#> [1] "314.159%"
format(as.percentage(pi), digits = 6)
#> [1] "314.1593%"
round(0.4455 * 100, 1) # mind the rounding
#> [1] 44.5
percentage(0.4455) # does not round to 44.5%
#> [1] "44.6%"
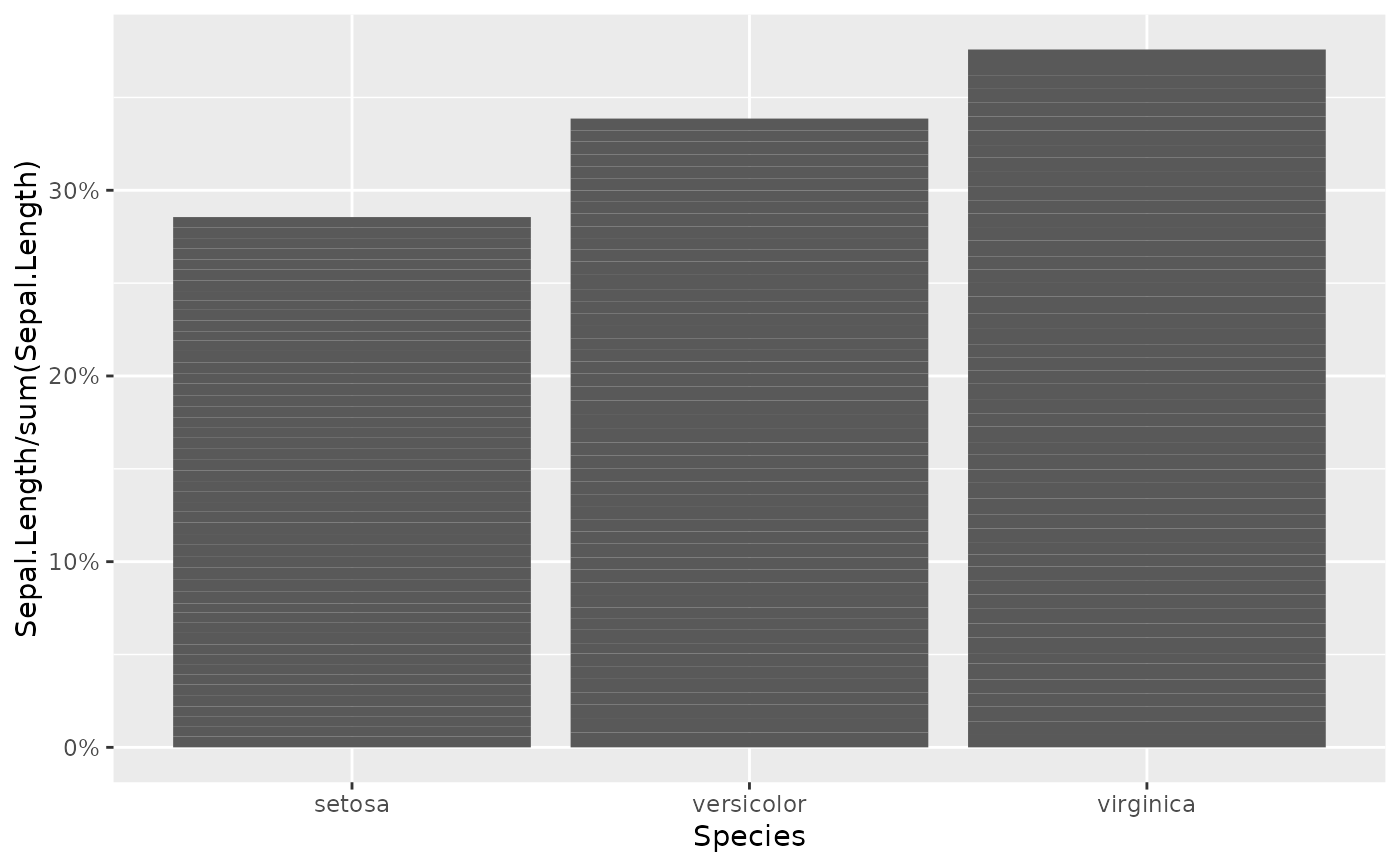
if (require("ggplot2")) {
ggplot(iris) +
geom_col(aes(Species, Sepal.Length / sum(Sepal.Length)),
position = "stack") +
# add percentage as function to the labels:
scale_y_continuous(labels = percentage)
}
#> Loading required package: ggplot2